
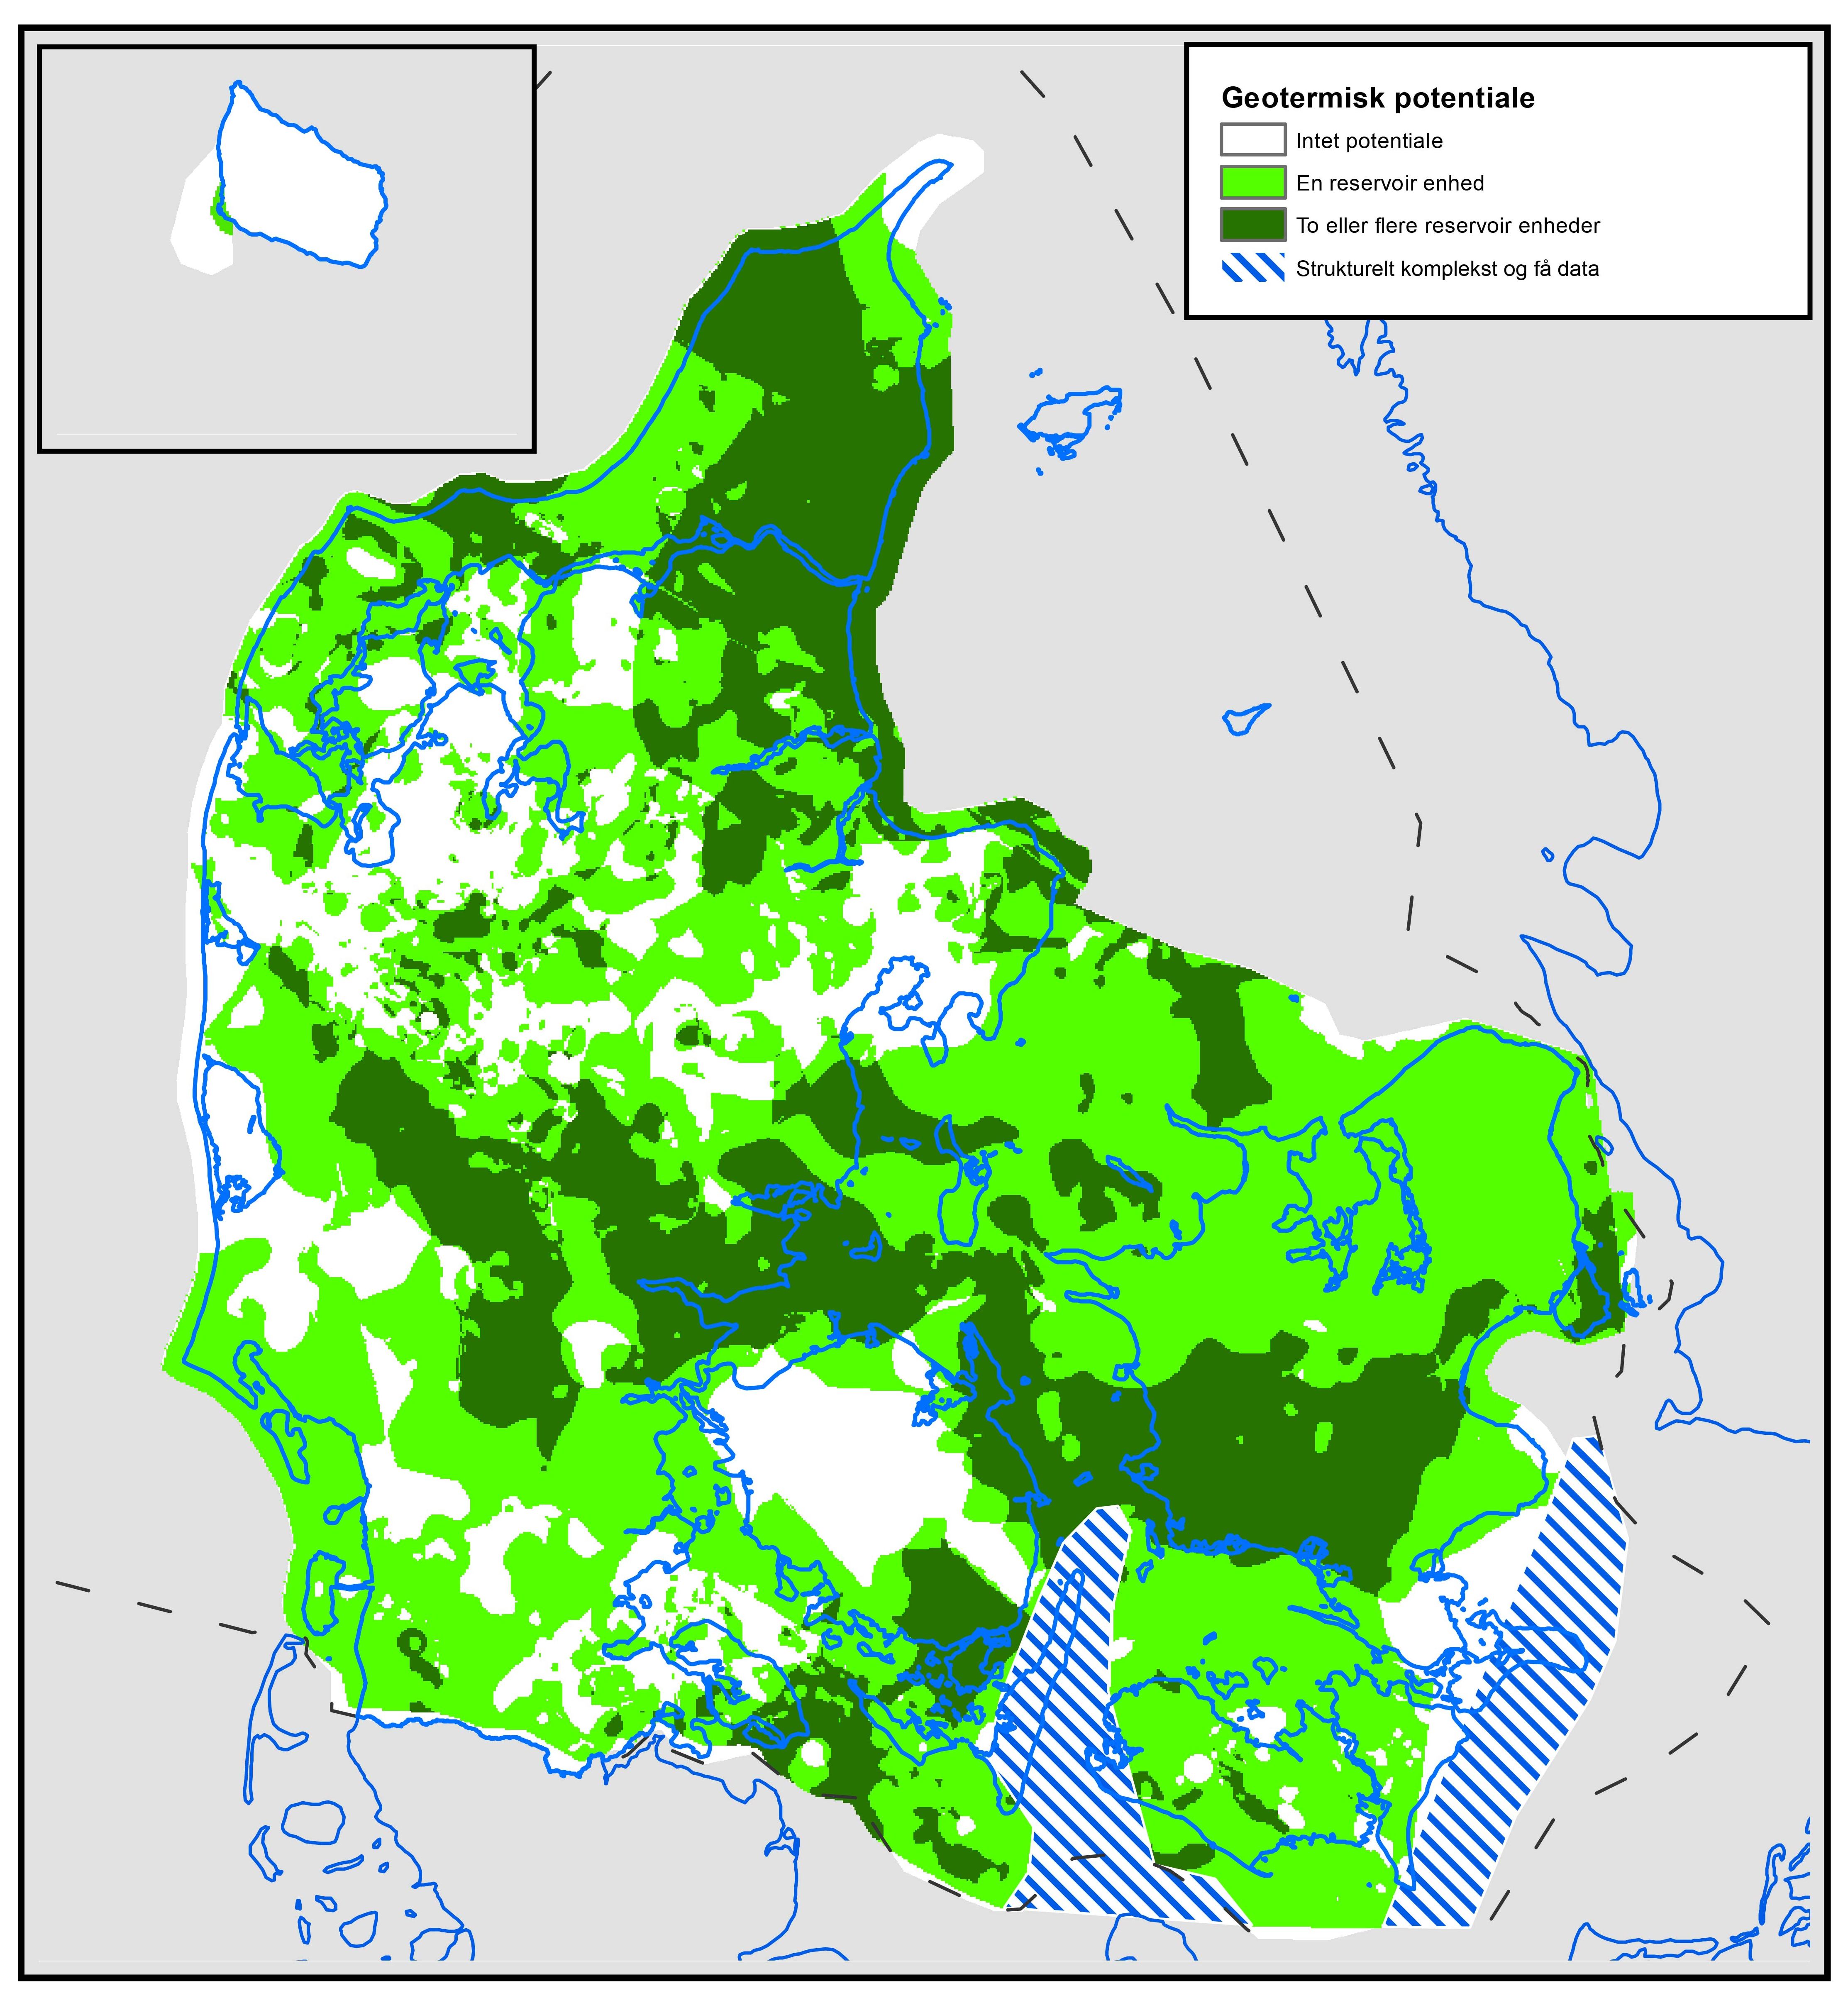
 The first map you meet is the geothermal potential map. The map gives an indication of where in the subsurface there are strata in the depth zone 800-3000 meters, which contain sandstone layers with good reservoir characteristics. The map can be used to focus the geothermal activities towards the most promising areas, thereby reducing the risk of investing large sums in areas which, based on our current knowledge, are not suitable for deep geothermal recovery.
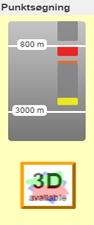 By clicking on the geothermal potential map, a bar chart appears at the bottom left of the page. The chart visualizes the depth down to and the thickness of the layer packages that the portal focuses on and which is mapped seismically. Strata that are considered to contain suitable geothermal reservoirs at the selected site are marked with a strong color. These are distinguished by being located within the depth zone 800-3000 meters and contain sandstone layers with good reservoir characteristics.
Via a 3D icon you will get access to a 3D tool that, among other things, visualizes the surface topography of the seismic interpolated depth maps in the area.
Once you have determined which layer package is relevant to the selected location, you can obtain more detailed information about the layer package by clicking on this in the bar chart or by selecting it under “Geothermal Reservoirs” in the column to the right of the map. This gives you access to a number of geological map themes that are specifically related to the chosen theme layer package; such as the layer package’s geothermal potential, depth and thickness and temperature. For all map themes, you can read a short explanatory text by clicking on the associated i. This also applies to the various overlay data that you can add to the map themes. These include, inter alia, some designed sections that provide an insight into the structure of the subsurface in different locations in Denmark.
The maps show the wells that reach the selected layer package, and the parameter value is also specified if it was possible to be calculated from drilling data.
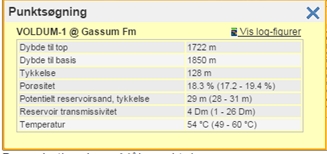 If you click on a well, a table will appear showing selected parameter values and for some of these also assessed uncertainty intervals. In many cases, from the table you can click on a log-figure showing, among other things, the distribution of sandstone and shale in the penetrated layer package.
It is the calculated parameter values from wells, which in combination with the interpretation of the seismic data is used to make the portal’s many surface maps. Behind the design construction of the maps are several elements of generalizations and approximations, and the maps should therefore only be considered as indicative and for use on a regional scale (Read more under ”Background info.”).